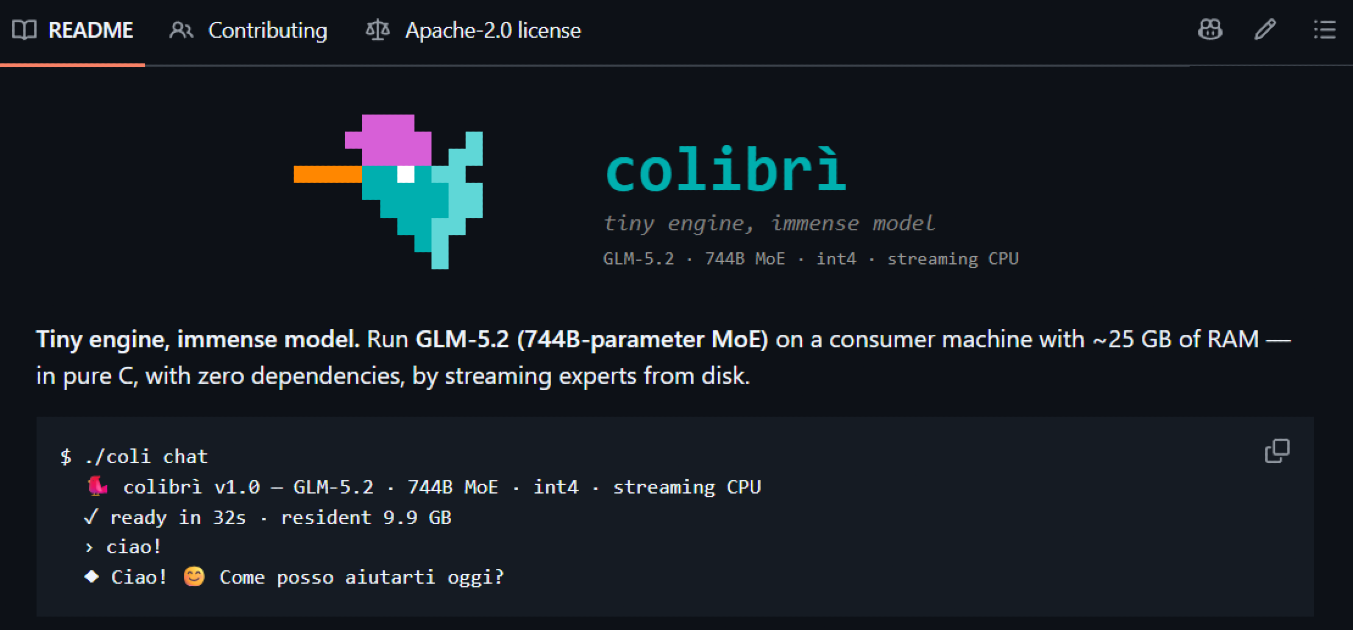
Running a 744-billion-parameter model on a laptop sounds like a joke until you look at what Mixture-of-Experts actually does at inference time. GLM-5.2 has 744B total parameters, but it only activates around 40B of them per token, and of that only about 11B actually change from one token to the next. That gap between "total size" and "working set" is exactly what a small open source project called colibrì exploits, and it does it in roughly 2,400 lines of dependency-free C.
No PyTorch, no CUDA requirement, no Python runtime. The engine loads a ~9.9 GB dense core into RAM and streams the remaining ~370 GB of quantized experts straight off an NVMe drive, layer by layer, token by token. On a 12-core laptop with 25 GB of RAM and no GPU, it boots GLM-5.2 in about 32 seconds and starts answering prompts.
The core idea: split the model by what actually moves
GLM-5.2 is a Mixture-of-Experts (MoE) transformer with 75 MoE layers, 256 experts per layer, plus an MTP (multi-token prediction) head. colibrì splits the model into two very different storage tiers:
- Dense part (always resident): attention, shared experts, embeddings — about 17B parameters, quantized to int4, sitting at ~9.9 GB in RAM the entire time.
- Routed experts (streamed): 21,504 individual experts (75 layers × 256 experts, plus the MTP head), each about 19 MB at int4, totaling roughly 370 GB on disk. These are pulled on demand with a per-layer LRU cache, an optional pinned "hot store" for frequently used experts, and the OS page cache acting as a free second-level cache.
This is the same principle behind virtual memory paging, just applied to transformer weights instead of application memory. Most of the model never needs to be in RAM at once — only the slice a given token actually routes to.
What's actually implemented (this isn't a toy)
It would be easy to dismiss this as a proof-of-concept, but the engine implements a genuinely faithful reproduction of GLM-5.2's architecture, validated token-exact against a Hugging Face Transformers oracle (32/32 teacher-forced positions, 20/20 greedy generations on a tiny model sharing the real architecture). Key pieces:
- MLA attention with compressed KV-cache — 576 floats per token instead of 32,768, a 57x reduction, since GLM-5.2 uses 64 attention heads with no grouped-query attention.
- DeepSeek-V3-style sigmoid router (noaux_tc, routed scaling factor) with a shared expert and dense-only first three layers.
- Native MTP speculative decoding using GLM-5.2's own multi-token-prediction head to draft tokens the main model verifies in a single batched forward pass. This only works if the MTP head is quantized to int8 — at int4 the draft acceptance rate collapses to 0-4%, but at int8 it hits 39-59% acceptance and 2.2-2.8 tokens per forward pass, measured by the community. It's lossless even under sampling, thanks to rejection sampling.
- Grammar-forced speculative drafts — when you're generating constrained output like JSON, the grammar file itself becomes a third source of draft tokens. Wherever the grammar admits exactly one legal byte, that span gets pre-accepted with near-100% acceptance. It never changes the actual output; a wrong grammar just means more rejected drafts.
- DSA sparse attention — GLM-5.2's lightning indexer for top-2048 causal key selection, validated exact against dense attention when forced to keep every key.
- KV-cache persistence — conversations survive engine restarts. The compressed KV cache gets appended to disk after every turn (~182 KB/token) and reloads with zero re-prefill.
- Router-lookahead prefetch (experimental, flag
PILOT=1) — the next layer's expert routing turns out to be 71.6% predictable from the current layer's post-attention state, so a dedicated I/O thread starts prefetching before it's needed.
The quantization kernels support int8, packed int4, and packed int2, all hand-written with AVX2 intrinsics. Integer-dot kernels measured 119 GFLOP/s and came in 1.4-2.5x faster than the f32 path for int8, though int4 single-row matmuls actually measured slower than f32 and get routed away automatically. That's a good example of the project's overall philosophy: decisions get made by measurement, not assumption.
Honest numbers, not marketing numbers
This is the part most projects skip. Here's what colibrì actually measured on its development machine — WSL2, 12 cores, 25 GB RAM, NVMe behind a VHDX layer:
| Metric | Value |
|---|---|
| Model on disk (int4) | ~370 GB |
| Resident RAM (dense, int4) | 9.9 GB |
| Load time | ~30 seconds |
| Peak RSS during chat | ~20 GB (auto-capped) |
| Cold decode cost | ~11 GB of disk reads per token |
| Cold throughput | 0.05-0.1 tokens/sec |
That is not a typo: on the reference hardware, a cold token can cost roughly one-tenth of a second per token or worse, because the VHDX layer caps random reads around 1 GB/s. The project is upfront about this — the README literally states "this is not fast." What it is, though, is a 744B frontier-class model producing correct output on a machine that costs less than a single H100's cooling fan.
Practical takeaway: if you're evaluating colibrì, don't judge it by raw tokens/sec on a laptop. Judge it by whether the accuracy-per-dollar tradeoff makes sense for your use case — batch processing, offline research, or just curiosity about frontier-scale models without cloud GPU bills.
Community benchmarks show the disk is the bottleneck, until it isn't
Once other people started running colibrì on their own hardware, a clear pattern emerged: RAM budget and disk speed trade off against each other in predictable ways.
| Machine | Config | Measured |
|---|---|---|
| Intel Core Ultra 7 270K Plus, 24 GB RAM, NVMe VHDX | default | 0.07 tok/s, 3-4% expert cache hit rate |
| Apple M5 Max, 128 GB unified memory, internal SSD | default, MTP off | 1.06 tok/s, 23% hit rate |
| Apple M5 Max, Metal backend, 96 GB RAM budget | 39.7 GB warm pin | 1.83 tok/s, 66% hit rate, warmed from 1.11 to 1.83 over the run |
| Ryzen AI 9 HX 370 (Framework 13), 128 GB RAM | int8 MTP head, 46.7 GB auto-learned pin | 0.37 tok/s, 66% hit rate, 52% MTP acceptance |
| Ryzen 9 9950X, Crucial P3 QLC NVMe → swapped to Samsung 9100 PRO PCIe 5.0 | same history, disk swapped | 0.10 → 0.28 tok/s (2.9x from 5.8x more disk bandwidth) |
Two things stand out here. First, a machine with only 24 GB of RAM caps the expert cache down to just 2 slots per layer, which keeps decode cold even when the disk itself is 2-2.7x faster than the reference box — RAM, not disk, is the actual bottleneck at that budget. Second, the Ryzen 9950X pair is a clean natural experiment: same machine, same usage history, only the drive changed, and a 5.8x disk bandwidth increase bought a 2.9x token throughput increase while the bottleneck flipped from 66% disk-bound to 57% matmul-bound. Past roughly 5 GB/s of disk bandwidth, the CPU kernels (or an optional CUDA expert tier) become the limiting factor instead of the drive.
Practical takeaway: if you're trying colibrì on your own hardware, run iobench first to measure your actual random-read throughput, then set your RAM budget as high as you safely can. The project added an auto-raising expert cache in July 2026 specifically because earlier versions capped a 128 GB machine to the same cache size as a 16 GB one.
Speculative decoding and the "learning cache"
Two features are worth calling out separately because they compound over a session rather than being fixed costs.
The MTP speculative decoding uses GLM-5.2's own trained draft head, not a separate smaller model, so acceptance rates are high (39-59% measured) and the output stays lossless. But there's an honest caveat in the docs: on a cold cache, each verified draft can route to extra experts that haven't been loaded yet, pushing per-token expert loads from around 660 up to around 1,100. That means speculation can be a net time loss until the expert cache warms up, which is why there's an adaptive guard and a way to disable it entirely with DRAFT=0.
The second feature is a simple learning cache: colibrì logs which experts your actual usage routes to in a .coli_usage file next to the model, and pins the hottest ones in spare RAM on the next startup. The Framework 13 benchmark row above is the clearest demonstration of this working end to end — hit rate climbed from 28% to 66% and throughput nearly doubled purely by letting the cache learn from repeated use, no code changes required.
Getting it running
The full pipeline is one command for the model side. It downloads the GLM-5.2 FP8 checkpoint shard by shard — never needing the full 756 GB on disk at once — converts each shard to the int4 container, and converts the MTP head for speculative decoding:
cd c
./setup.sh                      # checks gcc/OpenMP, builds, self-tests
./coli convert --model /nvme/glm52_i4     # needs ~400 GB free on ext4/NVMe

COLI_MODEL=/nvme/glm52_i4 ./coli chat
If you'd rather skip the multi-hour conversion, a pre-converted int4 build is already on Hugging Face at jlnsrk/GLM-5.2-colibri-int4, with a community-maintained int8-MTP variant from a contributor named matey-0 if the original MTP files turn out to be int4 (which the README flags as unusable for speculative decoding).
Before committing disk space, coli plan and coli doctor are worth running first. plan reads only the safetensors headers to report your model's exact memory footprint and a bounded VRAM tier without touching any tensors. doctor does a read-only readiness check — validating the model directory, tokenizer, available RAM, and CUDA linkage — before you spend 30 seconds loading a 370 GB model only to hit an OOM.
COLI_MODEL=/nvme/glm52_i4 ./coli doctor --gpu 0 --ram 128 --jsonAn OpenAI-compatible server, with real limits stated upfront
colibrì also ships coli serve, a standard-library-only Python gateway in front of the C engine, exposing /v1/chat/completions and /v1/completions with SSE streaming, usage counts, and GLM-5.2's enable_thinking reasoning mode. It's deliberately text-only for now — tool calls, image input, log probabilities, and custom stop sequences return an explicit error rather than silently doing nothing, which is the right call for a project this early.
Because there's a single 744B model resident in one process, concurrent requests queue through a bounded FIFO admission system (--max-queue, default 8) rather than pretending to run true parallel inference. You can even give it isolated KV-cache "slots" — up to 16 independent conversation contexts — with the cache_slot field, though each slot costs real RAM at your configured context length.
curl http://127.0.0.1:8000/v1/chat/completions \
  -H 'Authorization: Bearer local-secret' \
  -H 'Content-Type: application/json' \
  -d '{
    "model": "glm-5.2-colibri",
    "messages": [{"role": "user", "content": "Hello"}],
    "stream": true
  }'
Where this is genuinely useful, and where it isn't
Be clear-eyed about the tradeoffs. At 0.05-0.1 tokens/sec on modest hardware, colibrì is not a chatbot replacement and nobody involved in the project claims it is. It's not going to compete with a hosted API for interactive use unless you're running it on something with a fast PCIe5 NVMe array and 128+ GB of RAM, where community numbers suggest 2-4 tokens/sec is realistic.
Where it's genuinely interesting: offline batch workloads where latency doesn't matter, research into MoE expert routing behavior, running a frontier-scale open weight model entirely locally for privacy reasons, or just understanding how modern MoE inference engines actually work under the hood by reading 2,400 lines of readable C instead of a sprawling framework. The project's own quality benchmark harness (MMLU, HellaSwag, ARC via coli bench) is still waiting on someone with faster hardware to run a full pass and confirm the int4 quantization holds up against GLM-5.2's published 85-95% scores on those tasks — an open call for community data that any reader with a beefy home server could actually help answer.
Practical takeaway: if you have spare NVMe space, 25+ GB of RAM, and curiosity rather than a production deadline, colibrì is a legitimate way to run a 744B model on hardware you already own. Start with iobench to know what you're working with, use the pre-converted Hugging Face weights to skip the conversion step, and let the learning cache do its job over a few sessions before judging the throughput.